-
Q3 2022 Update: Unofficial Problem Bank list Decreased to 51 Institutions; Search for "Whale" Continues
http://www.calculatedriskblog.com/2022/10/q3-2022-update-unofficial-problem-bank.html
-
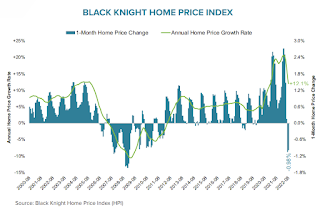
Black Knight Mortgage Monitor: "Home Prices Down Again in August … Now 2% Off June Peak"
http://www.calculatedriskblog.com/2022/10/black-knight-mortgage-monitor-home.html
-
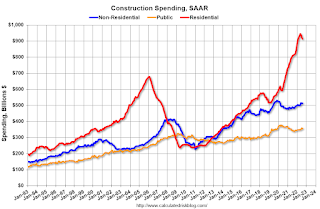
Construction Spending Decreased 0.7% in August
http://www.calculatedriskblog.com/2022/10/construction-spending-decreased-07-in.html
-
ISM® Manufacturing index Declined to 50.9% in September
http://www.calculatedriskblog.com/2022/10/ism-manufacturing-index-declined-to-509.html
-
Housing October Update: Inventory Increased 0.8% Last Week; Hits New Peak for 2022
http://www.calculatedriskblog.com/2022/10/housing-october-update-inventory.html
-
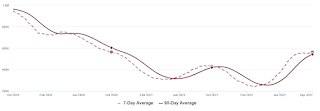
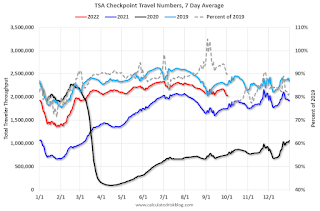
Four High Frequency Indicators for the Economy
http://www.calculatedriskblog.com/2022/10/four-high-frequency-indicators-for.html
-
Monday: ISM Mfg, Construction Spending
http://www.calculatedriskblog.com/2022/10/monday-ism-mfg-construction-spending.html
-
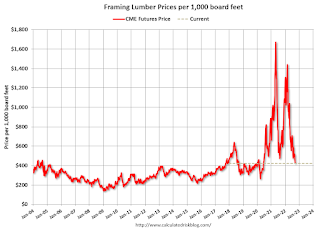
Update: Framing Lumber Prices Close to Pre-Pandemic Levels
http://www.calculatedriskblog.com/2022/10/update-framing-lumber-prices-close-to.html
-
Real Estate Newsletter Articles this Week
At the Calculated Risk Real Estate Newsletter this week: • Goldman Sees US House Prices Falling 5% to 10%• Case-Shiller: National House Price Index “Continued… Real Estate Newsletter Articles this Week
-
Schedule for Week of October 2, 2022
The key report this week is the September employment report on Friday. Other key indicators include the September ISM Manufacturing and Services indices, September auto sales and the August trade deficit. —– Monday, Oct 3rd —–10:00 AM: ISM Manufacturing Index for September. The consensus is for a reading of 52.2, down from 52.8 in August. 10:00 AM: Construction Spending for August. The consensus is for a 0.3% decrease. —– Tuesday, Oct 4th —–8:00 AM ET: Corelogic House Price index for August. 10:00 AM: Job Openings and Labor Turnover Survey for August from the BLS. This graph shows job openings (black line), hires (purple), Layoff, Discharges and other (red column), and…